

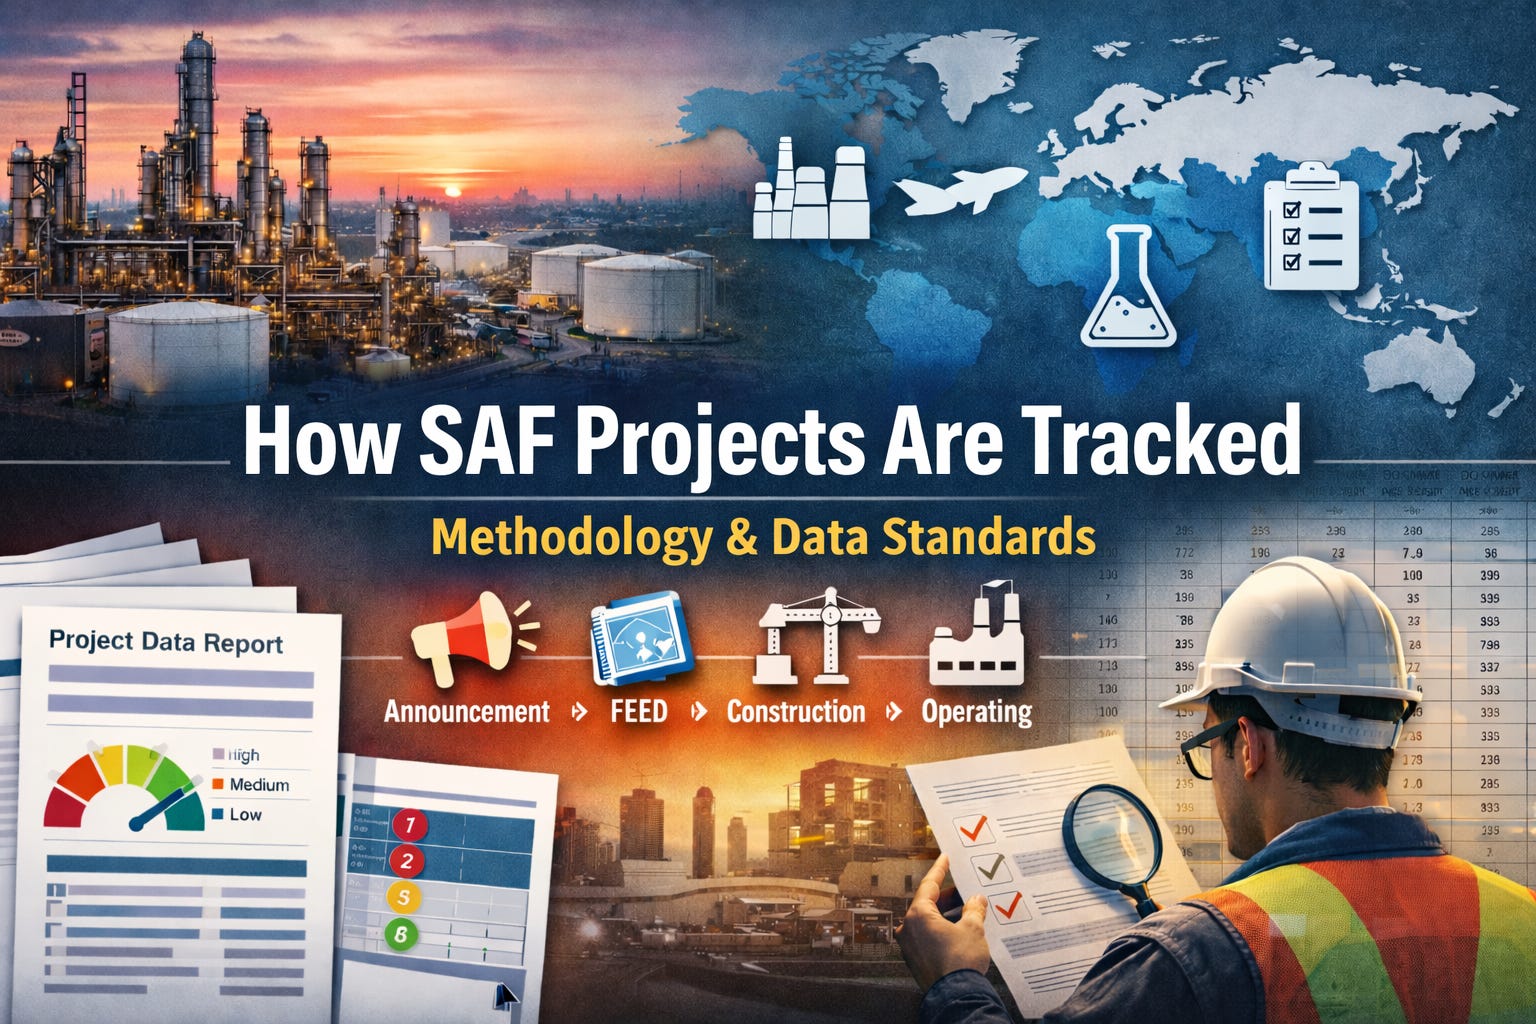
A market intelligence publication is only as useful as the discipline behind its data. Before reading analysis from this platform, it helps to understand how project data is collected, classified, standardised, and quality-checked. This note sets out the framework used in the Axial Intelligence SAF Project Tracker and explains how the publication turns a noisy pipeline of project announcements into a more decision-useful view of likely SAF supply.
What gets tracked
The SAF Project Tracker covers global projects involved in the production of sustainable aviation fuel across the full development cycle, from early concept announcements through to commercial operation. Coverage includes dedicated SAF plants, flexible renewable fuels facilities with SAF production capability, refinery co-processing units, alcohol-to-jet facilities, Fischer-Tropsch gasification plants, and power-to-liquid installations.
A project is included when it meets three conditions: it produces or is credibly planned to produce SAF as a primary or significant co-product; it has been publicly announced by the developer, confirmed by a government source, or identified in a credible trade publication; and sufficient information exists to assign at minimum a country, technology pathway, and project stage. Projects are excluded where they relate only to renewable diesel or HVO with no credible SAF pathway, where they are limited to blending or distribution infrastructure rather than fuel production, or where they duplicate an existing tracked entry.
The tracker does not claim complete global coverage. It is a bounded project universe built on what can be verified. Coverage gaps remain, particularly in parts of China where plant-level data is harder to confirm, in some African markets where project-level disclosure is still thin, in European co-processing sub-units embedded within larger refinery systems, and in US biorefinery conversions where SAF splits are not always separately disclosed. All analytical claims published through this platform are therefore bounded to the tracked project universe and should not be read as global constants.
How capacity is handled
The tracker follows a strict capacity derivation chain rather than treating all published numbers as interchangeable. At the broadest level, nameplate capacity captures total renewable fuels output at the facility level. Where a source discloses SAF-specific output, that figure is recorded as estimated SAF capacity and is the preferred basis. Where a source discloses total renewable fuels capacity but not a SAF split, modelled SAF capacity is derived using pathway-specific SAF share assumptions. That modelled SAF capacity is the single capacity basis used across the scenario framework and downstream analytical outputs.
This matters because headline renewable fuels capacity and realistic SAF capacity are not the same thing. A multi-product facility may produce renewable diesel, SAF, naphtha, or other co-products, and those volumes should not be collapsed into one undifferentiated SAF number. The tracker therefore preserves the distinction between total facility capacity, disclosed SAF capacity, and modelled SAF capacity before applying any scenario logic.
All capacity figures are standardised to kilotonnes per year using defined conversion assumptions for barrels per day, US gallons, cubic metres, and selected CAPEX currency conversions where relevant. Where capacity is derived rather than directly disclosed, that treatment is documented in the project record.
How project stages are defined
Not all SAF projects are equal. A facility in commercial production today is fundamentally different from an early concept with no engineering commitment, financing, or construction progress. Treating both as equivalent inflates pipeline numbers and can create a misleading impression of likely deliverable supply.
Each project is assigned to one of eight mutually exclusive stages based on the highest-quality available evidence, not on developer language alone: Operating, Construction, FID, Pre-FID, Announced, Pilot/Demonstration, On hold / delayed, and Cancelled. Stage assignment is evidence-based and conservative. For example, an EPC announcement does not by itself place a project under construction unless physical works are clearly underway, and first production of on-spec fuel does not automatically qualify a facility as fully operating if commercial production has not yet been confirmed.
How probabilities and scenarios are applied
The tracker uses a two-tier probability framework. Each project stage carries a baseline commissioning probability, but that baseline can be adjusted at the individual project level where project-specific evidence supports a different risk profile. This produces a more useful risk-adjusted view of the pipeline than a rigid stage-only lookup. Operating and Cancelled projects are fixed at their respective endpoints and are not adjusted.
Analyst adjustments are applied conservatively and only within documented ranges. Every probability assignment carries a stated basis, and non-default adjustments require an explicit rationale tied to project-specific evidence such as financing strength, operator credibility, technology maturity, policy support, or verification quality. If that rationale becomes stale or is contradicted by new evidence, the project reverts to the stage baseline until reviewed again.
The tracker applies three scenarios to the modelled SAF pipeline. The base scenario is the primary analytical metric and applies each project’s commissioning probability to modelled SAF capacity. The bear scenario adds a second layer of downside stress through an exposure framework that considers developer, financing, technology, and policy risk. The bull scenario assumes full modelled capacity for active projects, a partial recovery case for on-hold projects, and zero contribution from cancelled projects. Together, these scenarios help separate gross announced pipeline from more realistic supply ranges.
How feedstocks are handled
Feedstock data is normalised to a controlled vocabulary of nine categories while preserving verbatim source language in the underlying project record. The core categories include UCO, animal fats, PFAD, vegetable oils, mixed waste oils, MSW/RDF, alcohol feedstock, CO2 plus green hydrogen for PtL, and industrial off-gases. Where a project uses more than one feedstock family, all relevant categories are recorded.
Feedstock demand is estimated using pathway-specific conversion yield ratios rather than a flat default feedstock-to-fuel factor. Hydroprocessing, co-processing, ATJ, MTJ, Fischer-Tropsch, and other pathways each carry distinct yield assumptions reflecting differences in conversion efficiency. Where a project discloses explicit feedstock intake through operator documentation or financing materials, that disclosed figure overrides the modelled estimate and the departure is flagged.
For multi-feedstock projects, demand is allocated across primary, secondary, and other feedstock families using a structured flexibility framework rather than a simple single-bucket assumption. This improves comparability when analysing feedstock competition across pathways, regions, and project types.
SAF taxonomy and timeline logic
The tracker uses a two-axis classification framework. SAF category captures the carbon source, distinguishing HEFA, e-SAF, and bio-SAF. Conversion process captures the technology route, such as hydroprocessing, co-processing, ATJ, MTJ, Fischer-Tropsch, or other pathways. Together, these two dimensions allow market-level aggregation without losing the technical logic behind individual projects.
Each project also carries three timeline anchors: the earliest deliverable year, the estimated start year where no disclosed start year exists, and the full run-rate year. Formula-based timeline estimation is used only where public disclosure is incomplete, with stage-based offsets applied conservatively and ramp-up periods differentiated where the pathway warrants it. This helps avoid overstating near-term supply from early-stage or technically complex projects.
Sources, verification, and confidence
Primary sources are prioritised wherever possible. These include operator or developer press releases, technology licensor announcements, EPC award disclosures, government and certification body releases, and project finance documentation. Reputable trade press and market intelligence publications are used as supporting sources where appropriate, but the source hierarchy is explicit and conservative. Technology licensor attribution is assigned only where it is explicitly stated in a primary source or in the licensor’s own disclosure. It is not inferred from industry norms. Where credible sources conflict on capacity, stage, or project status, the conflict is flagged in the project record rather than silently resolved.
Each project is also assigned a confidence level of High, Medium, Low, or Watchlist to reflect the quality and completeness of the available evidence base. Confidence level does not directly determine weighted capacity, which is driven by stage and analyst adjustment, but it is used as a qualitative signal where evidence quality materially affects interpretation. Project rows also carry verification and review dates so stale records can be identified and prioritised for re-checking before they are used in published outputs.
What is not claimed
The tracker is not presented as a complete census of global SAF activity. It is an evidence-based project universe built to support disciplined comparative analysis. As a result, numbers published through this platform should not be interpreted as complete global supply totals or as a substitute for company-level diligence, regulatory filings, or project finance documentation. The purpose of the tracker is not to eliminate uncertainty, but to make it more visible, more structured, and more analytically useful.
A living dataset
The SAF Project Tracker is version-controlled and updated on a rolling basis as new evidence becomes available. Project additions, status changes, probability revisions, capacity updates, confidence adjustments, and methodology refinements are incorporated through regular review cycles. Each project record carries verification metadata, and stale records are flagged for priority re-verification. The current public methodology published in April 2026.
Questions about methodology or data sourcing can be directed through the publication contact channel.