


The companion free post established the headline finding: probability weighting reduces the global SAF pipeline from 39.7 Mt/yr gross to 19.5 Mt/yr, a 51% discount. This paid edition provides the operator-level evidence, the scenario range, the regional discount map, and the exposure-band overlay that explains where inflation concentrates and what it means for specific market participants.
1. The Three Scenarios: Bounding the Pipeline
The Axial Intelligence SAF Project Tracker generates three capacity scenarios from the same 279-project dataset.
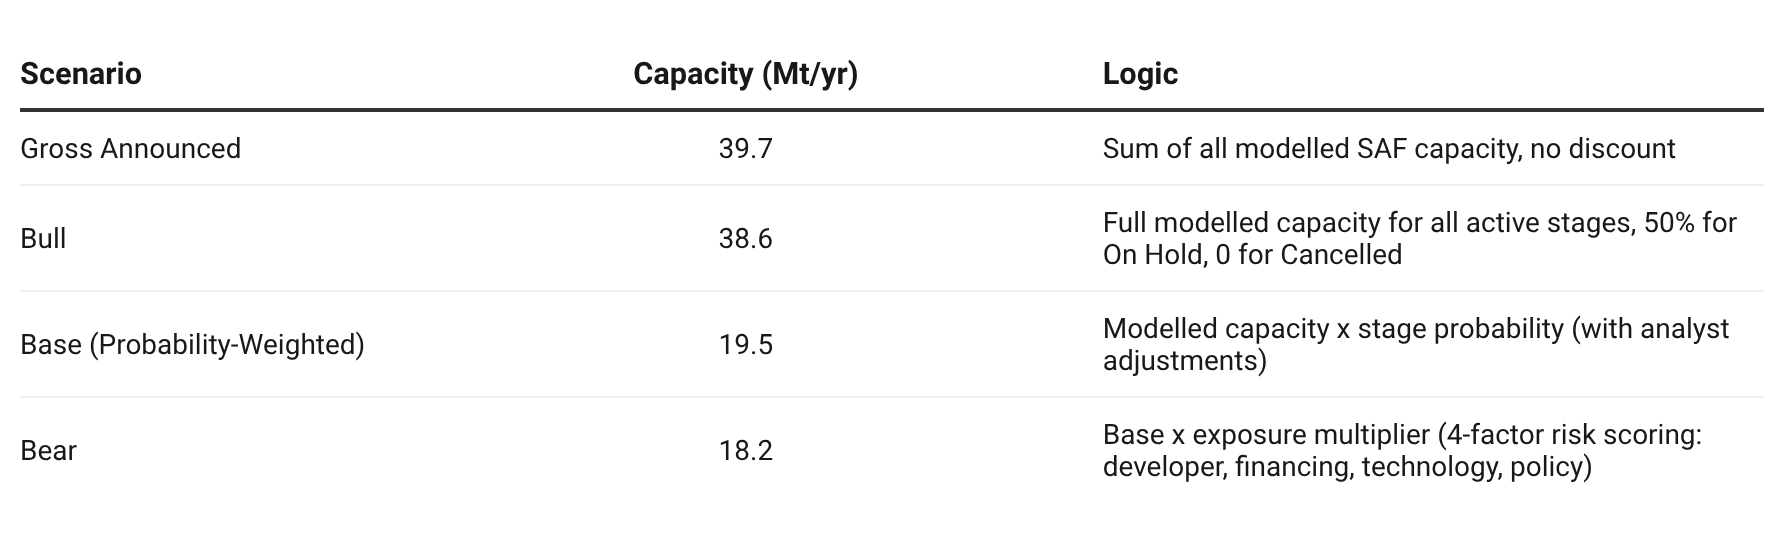
The bull scenario differs from gross only in its treatment of On Hold (3 projects, 634 kt halved to 317 kt) and Cancelled (8 projects, 735 kt zeroed). The practical spread between bull and base is 19.1 Mt/yr, the largest gap in the scenario framework, reflecting the distance between aspiration and probability-adjusted reality.
The bear scenario applies an additional downside multiplier derived from a four-factor exposure model. Projects scoring High (cumulative 6-8 on four risk dimensions) receive a 0.80 multiplier on base capacity. Medium (3-5) receives 0.90. Low (0-2) passes through unchanged. The base-to-bear gap is 1.3 Mt/yr (6.6%), a relatively narrow downside that reflects the fact that most weighted capacity is already concentrated in Operating and Construction stages where exposure multipliers have limited effect.
2. Operator-Level Probability Discount: Top 20
The following table ranks the 20 largest operators by gross announced SAF capacity and shows the absolute and percentage discount after probability weighting.