
The Global SAF Pipeline Is Overstated by 51%
What probability weighting reveals about near-term SAF availability

The global SAF project pipeline now tracks 279 projects with a combined announced capacity of 39.7 Mt/yr. That figure appears in conference slides, investor decks, and policy documents as evidence that the industry is scaling rapidly.
It is also misleading.
After applying stage-level commissioning probabilities, a framework that discounts each project according to its development maturity, the pipeline retains 19.5 Mt/yr. The discount is 51%.
This is not a rounding error or a modelling artefact. It is the gap between what has been announced and what is realistically deliverable, and it is large enough to reshape assumptions about SAF supply adequacy through the end of the decade.
Where the Discount Falls
The probability discount does not apply evenly. It concentrates in the stages where most of the announced capacity sits, and where the distance to commercial production is greatest.
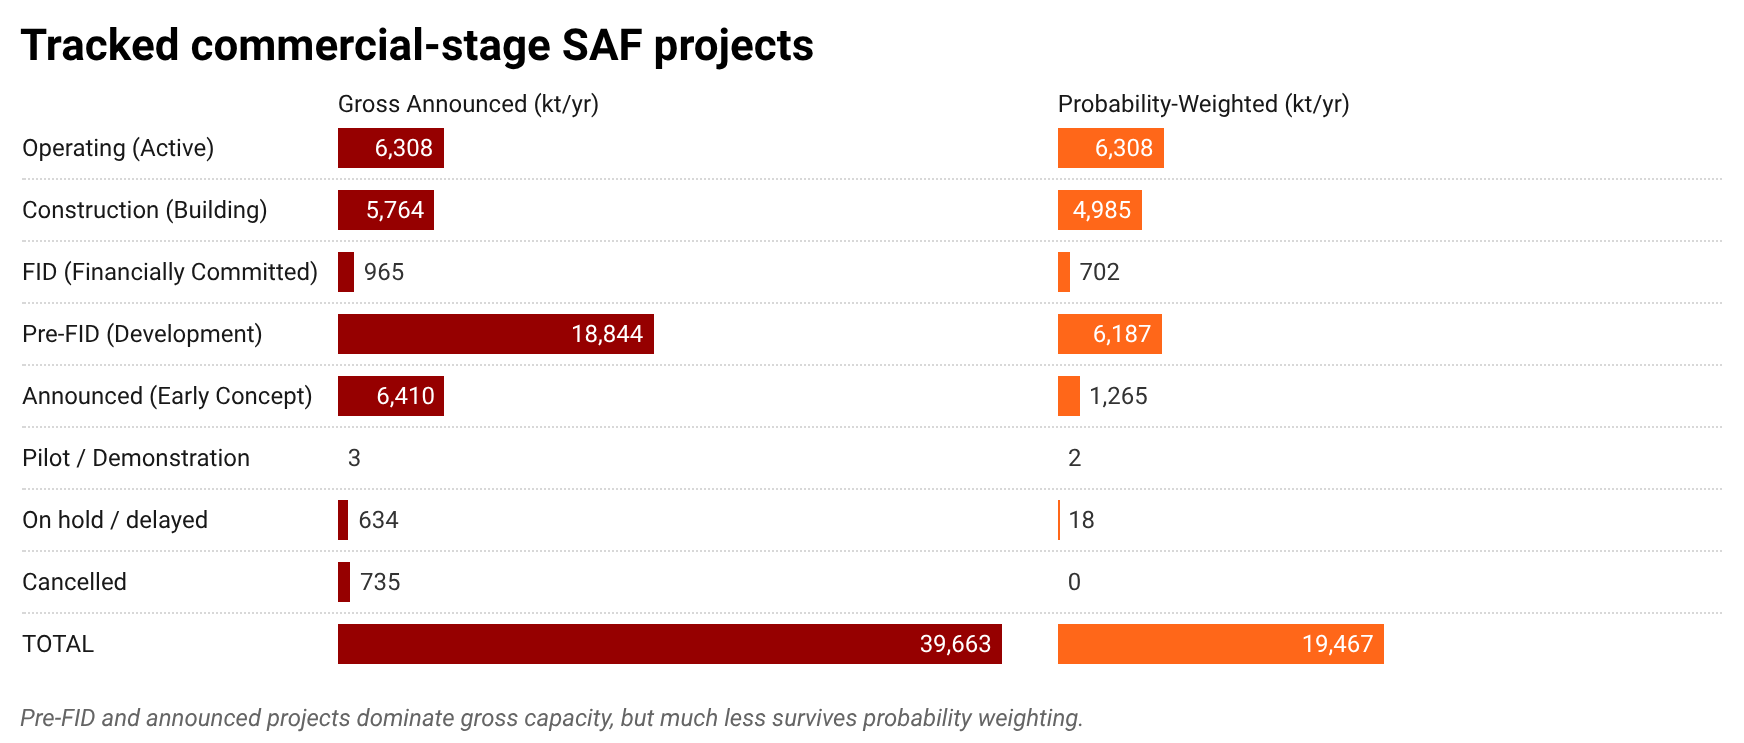
The 54 projects classified as Operating carry a commissioning probability of 1.00. Their 6.3 Mt/yr of capacity passes through the model unchanged, representing every kilotonne of SAF actually being produced today.
Construction-stage projects (31 tracked) retain 86% of gross capacity, reflecting EPC contracts signed and physical works underway. The 5.8 Mt/yr gross becomes 5.0 Mt/yr weighted.
From there, the discount steepens:
FID (5 projects): 965 kt gross, 702 kt weighted, a 27% discount.
Pre-FID (92 projects): 18,844 kt gross, 6,187 kt weighted, a 67% discount. This single stage accounts for nearly half of all announced capacity and absorbs the largest absolute reduction in the pipeline.
Announced (77 projects): 6,410 kt gross, 1,265 kt weighted, an 80% discount.
Cancelled (8 projects): 735 kt removed entirely.
The pattern is clear. The stages that dominate headline pipeline figures are precisely the stages that probability weighting discounts most aggressively.
Why the Gap Matters
SAF supply projections derived from gross announced capacity systematically overstate the realistic near-term outlook. This has direct consequences for three groups.
For airlines signing offtake agreements against pipeline expectations, the deliverable supply base is roughly half what headline figures suggest. Procurement strategies built on gross totals risk overpromising availability to corporate sustainability programmes.
For investors modelling SAF market size, the denominator is wrong. A developer claiming 2% market share of a 39.7 Mt pipeline is actually competing in a 19.5 Mt weighted market, doubling implied competitive intensity.
For policymakers calibrating mandates against expected supply, the gap between gross announcements and probability-weighted delivery is the margin of error in mandate feasibility. A mandate designed around 39.7 Mt of supply faces a different compliance picture when realistic delivery is 19.5 Mt.
The Pre-FID Concentration Problem
The most consequential finding in the waterfall is the Pre-FID stage. At 92 projects and 18.8 Mt/yr of gross capacity, Pre-FID accounts for 48% of the entire announced pipeline. After probability weighting at a baseline 0.40 (with analyst adjustments where warranted), it retains 6.2 Mt/yr.
The 12.7 Mt/yr that disappears in this single stage is larger than the entire operating SAF base globally. It represents projects that have progressed to FEED or licensor selection but have not yet secured financing. Many will advance. Many will not. The probability model reflects this reality; headline figures do not.
What the Full Tracker Reveals
The stage-level discount is the entry point. The deeper analysis, available to Axial Intelligence subscribers, includes the operator-level probability discount table (which developers carry the largest gap between gross and weighted capacity), the three-scenario comparison (bear at 18.2 Mt, base at 19.5 Mt, bull at 38.6 Mt), and the exposure-band overlay showing which projects within each stage carry elevated multi-factor risk.
The full SAF Project Tracker, covering all 279 projects across 104 analytical fields, is accessible through the Axial Intelligence premium dashboard.
→ Subscribe to access the full operator ranking, scenario sensitivity analysis, and project-level probability data.
Methodology: Probability-weighted capacity applies stage-level commissioning probabilities (Operating 1.00, Construction 0.90, FID 0.70, Pre-FID 0.40, Announced 0.20, Cancelled 0.00) to each project’s modelled SAF capacity. The two-tier system permits analyst adjustments within defined bands where project-specific evidence warrants departure from baseline. Full methodology documentation is available to subscribers.
Source: Axial Intelligence SAF Project Tracker v44, 279 projects, data cut April 2026.